
 Tinkerwell
Documentation
Note: Your development environment must be set up using Laravel Herd for this feature to work.
With XDebug, you can enable debug mode for your code, allowing you to pause execution at specific breakpoints.
For instance, suppose you have a getLicenses() method in your User class and you want to examine the logic within this method. You would set a breakpoint in your IDE like this:
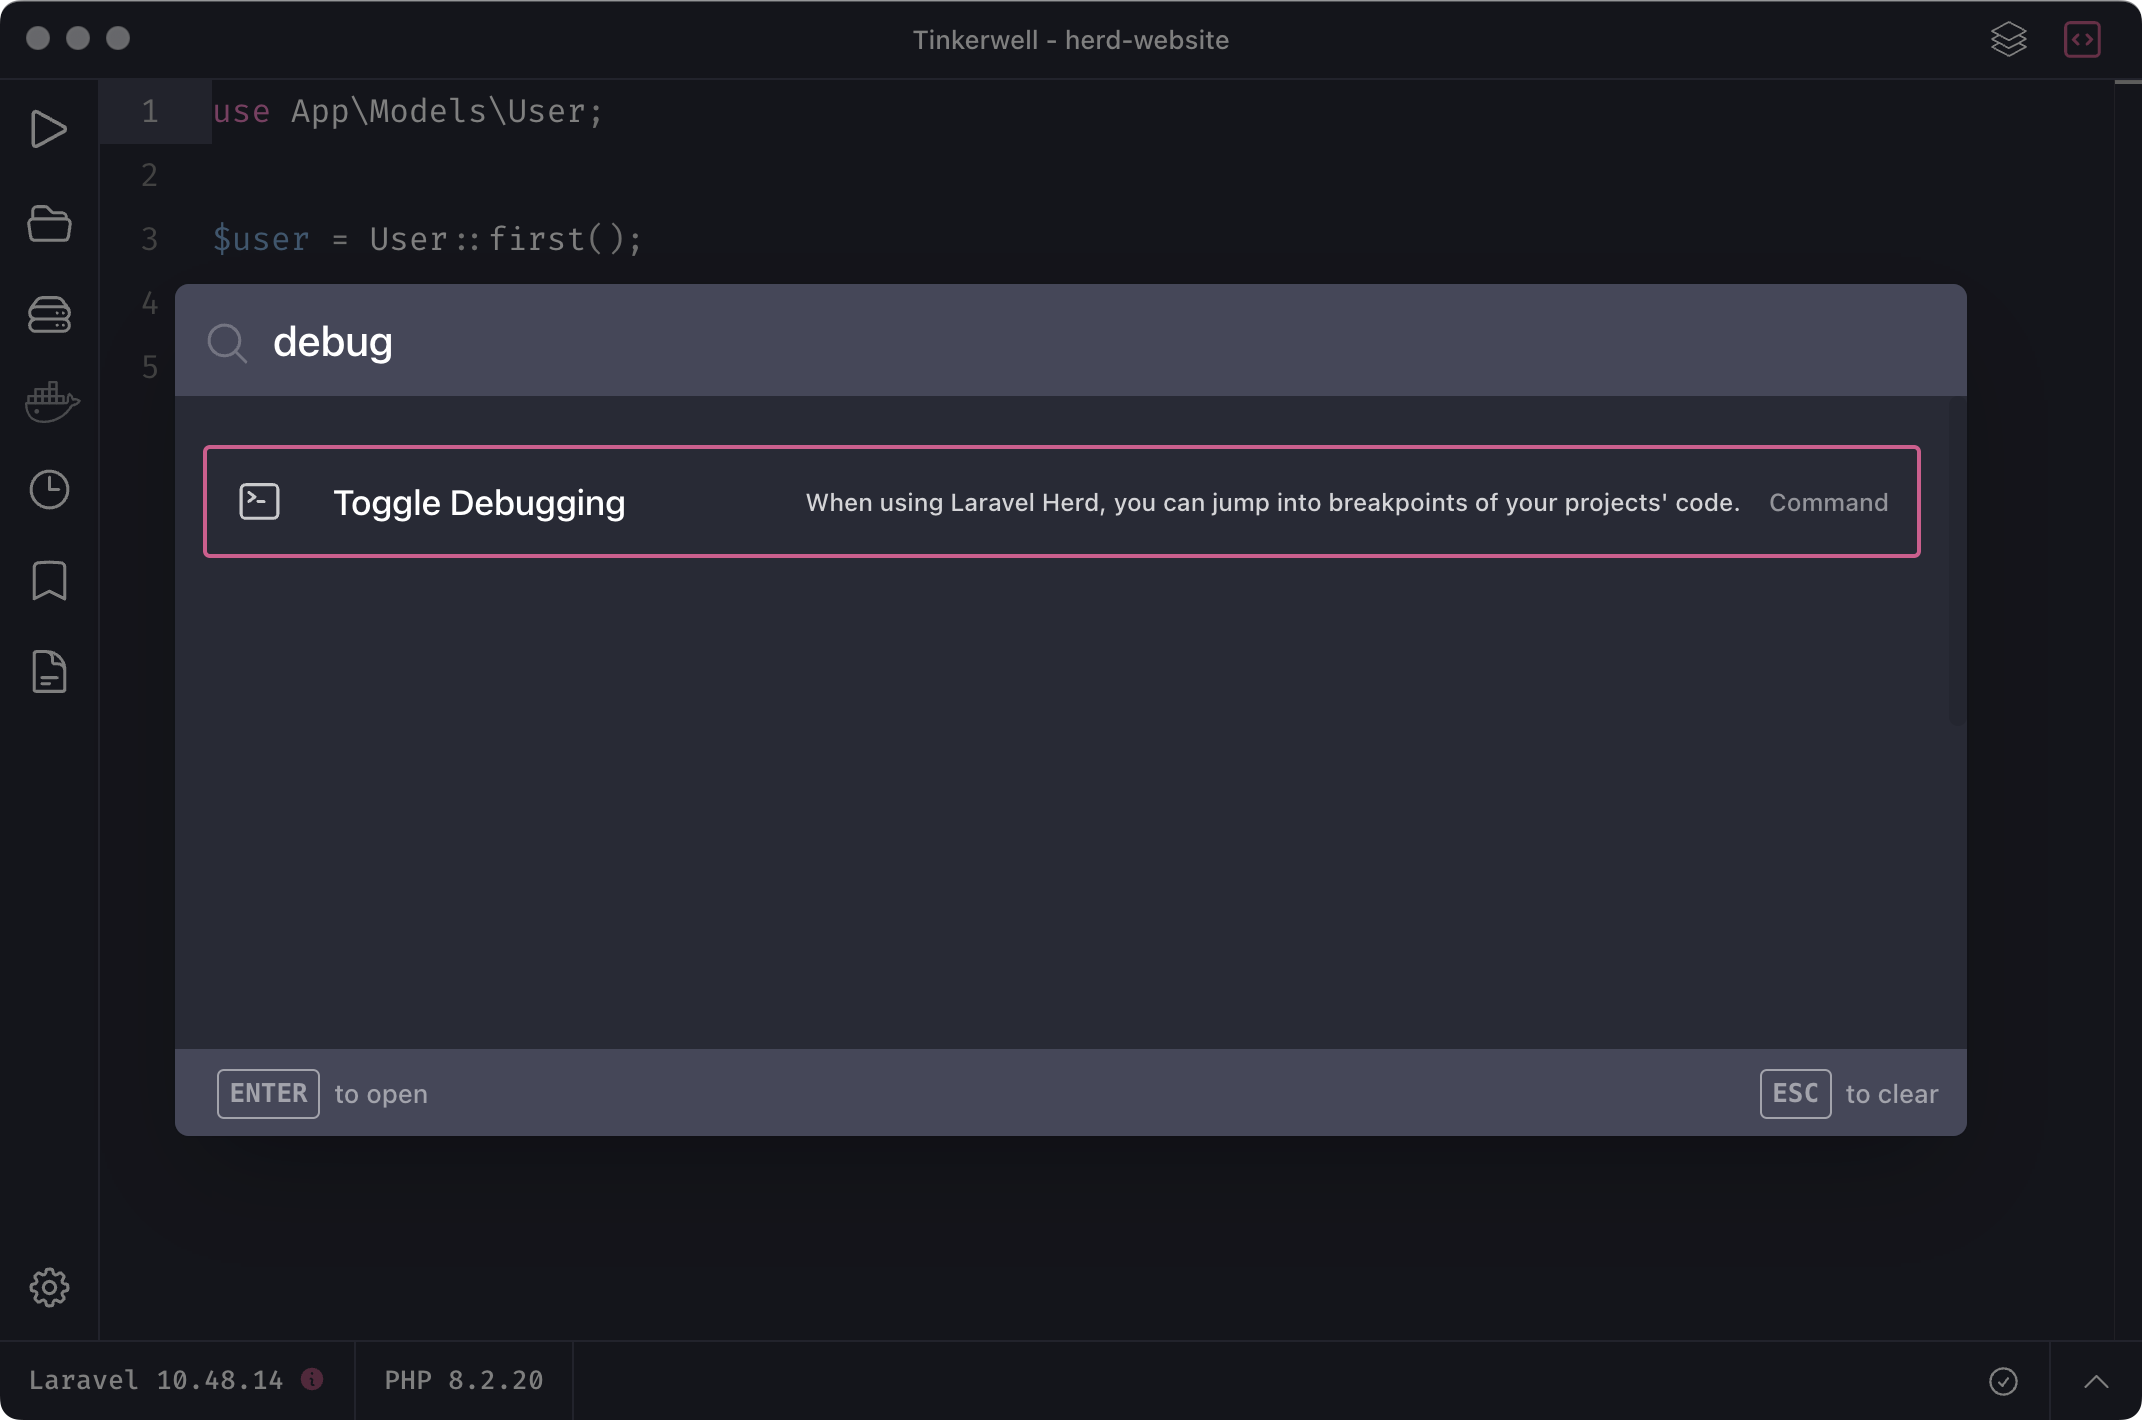
class User extends Model { public static function getLicenses() { $licenses = [];🔴 $some = "logic happens here"; return $licenses; }}Once you've configured your IDE to listen for breakpoints, open your project in Tinkerwell and press Cmd/Ctrl + Shift + P to open the command palette. Then, search for "Toggle Debugging":

This action will enable debugging for the current tab, indicated by a change in the Run Icon and a brief notification. You can disable debugging using the same method.
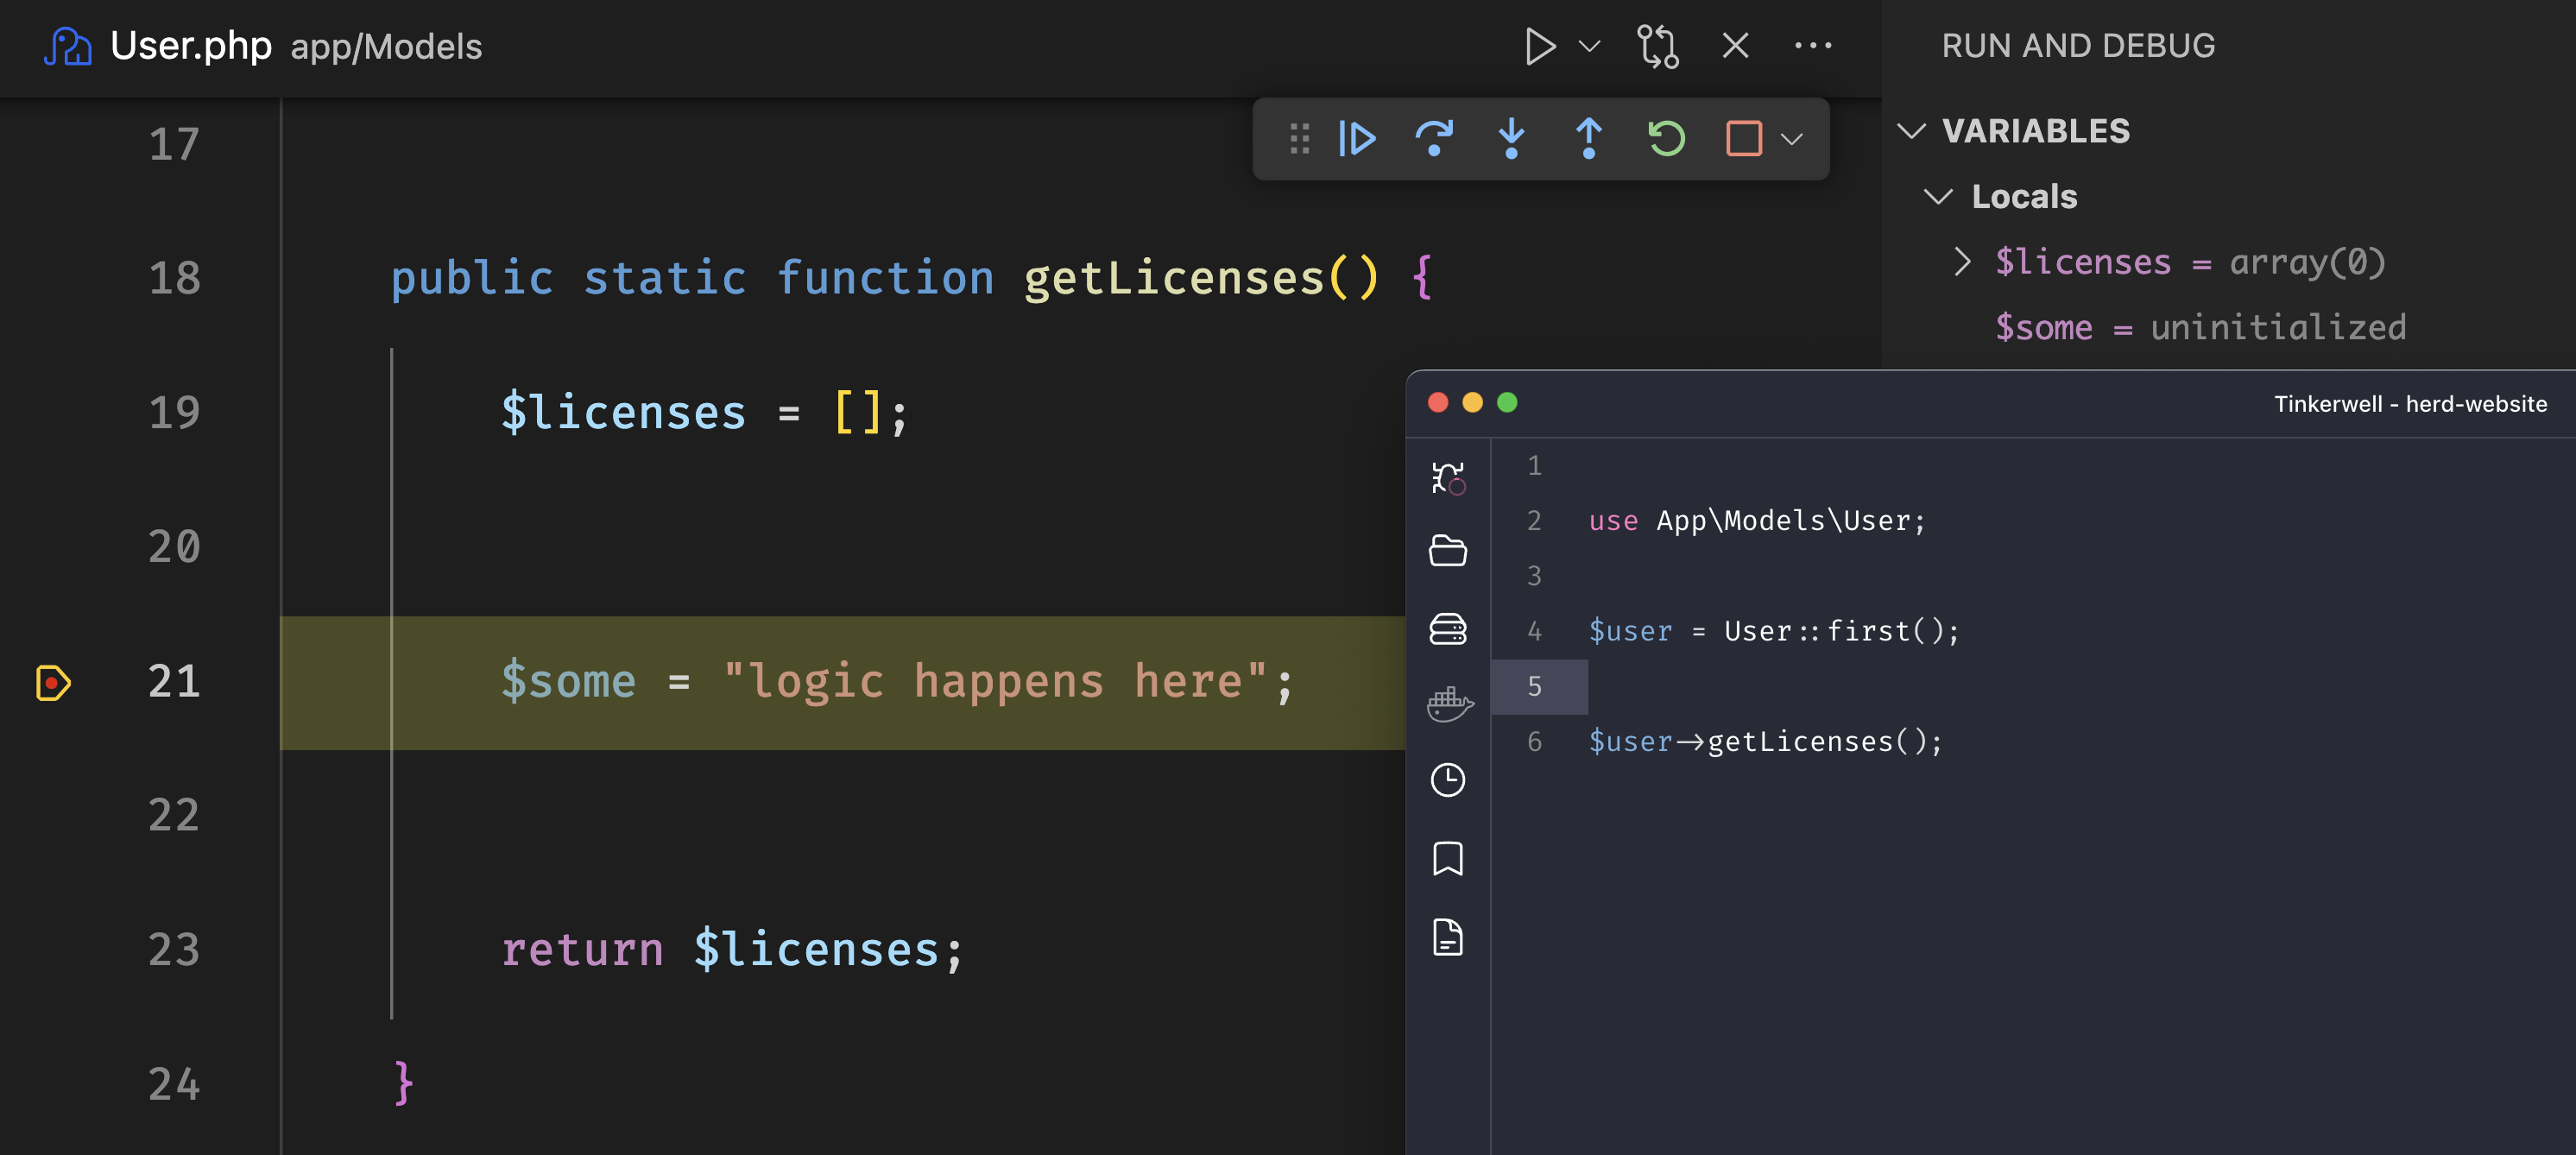
Now, when you press Cmd/Ctrl + R or click on the debug icon, Tinkerwell will initiate step debugging in your IDE, such as VS Code in this example:

Important: Debugging will automatically be disabled if you switch to using Docker/Vapor in a tab or connect to a remote server.
To enhance your debugging experience in VS Code with Tinkerwell, you can add the following skipFiles entry to your launch.json configuration file:
{ // launch.json "configurations": [ { "name": "Listen for Xdebug", "type": "php", "request": "launch", "port": 9003, "skipFiles": [ "**/CustomExecutionLoopClosure.php", "phar://**/*.php", "**/tinker.phar", "${workspaceFolder}/vendor/**/*.php", "vendor/**/*.php" ] } ]}Adding this configuration will prevent your debugger from stepping into irrelevant files, allowing you to focus on the code that matters.