
 Tinkerwell
How to get the raw SQL query from the Laravel Query Builder
Sometimes, you ask yourself how you can get the Laravel query builder to output its raw SQL query as a string. Luckily, there are multiple ways how to get this raw query.
The first method to get the query of an Eloquent call is by using the toSql() method. This method returns the query without running it – good if you don't want to alter data and only get the query – but this method doesn't show the whole query if your query is more complex or if there are sub-queries.
App\User::query() ->where('created_at', '<', now()->subYear()) ->with('assignedApps', 'courses') ->orderBy('email', 'asc') ->limit(5) ->toSql();Output:
select * from `users` where `created_at` < ? order by `email` asc limit 5The second method is the Laravel query log that collects all queries within a request. You can enable this log, run your query and dump the output.
DB::enableQueryLog(); App\User::query() ->where('created_at', '<', now()->subYear()) ->with('assignedApps', 'courses') ->orderBy('email', 'asc') ->limit(5) ->get(); dd(DB::getQueryLog());This code leads to the output:
array:3 [▼ 0 => array:3 [▼ "query" => "select * from `users` where `created_at` < ? order by `email` asc limit 5" "bindings" => array:1 [▼ 0 => Illuminate\Support\Carbon @1588525477 {#1595 ▶} ] "time" => 7.97 ] 1 => array:3 [▼ "query" => "select `apps`.*, `user_apps`.`user_id` as `pivot_user_id`, `user_apps`.`app_id` as `pivot_app_id`, `user_apps`.`created_at` as `pivot_created_at`, `user_apps`.` ▶" "bindings" => [] "time" => 2.81 ] 2 => array:3 [▼ "query" => "select `courses`.*, `user_courses`.`user_id` as `pivot_user_id`, `user_courses`.`course_id` as `pivot_course_id`, `user_courses`.`created_at` as `pivot_created_ ▶" "bindings" => [] "time" => 0.54 ]]This gives you detailed information about the executed query and their execution time. If the query has data bindings, the query logs lists them and makes it easy to check your data,
While you can get the raw SQL query with the methods above, there are situations where you debug the runtime or memory allocation of a query and want to know why it takes longer than expected.
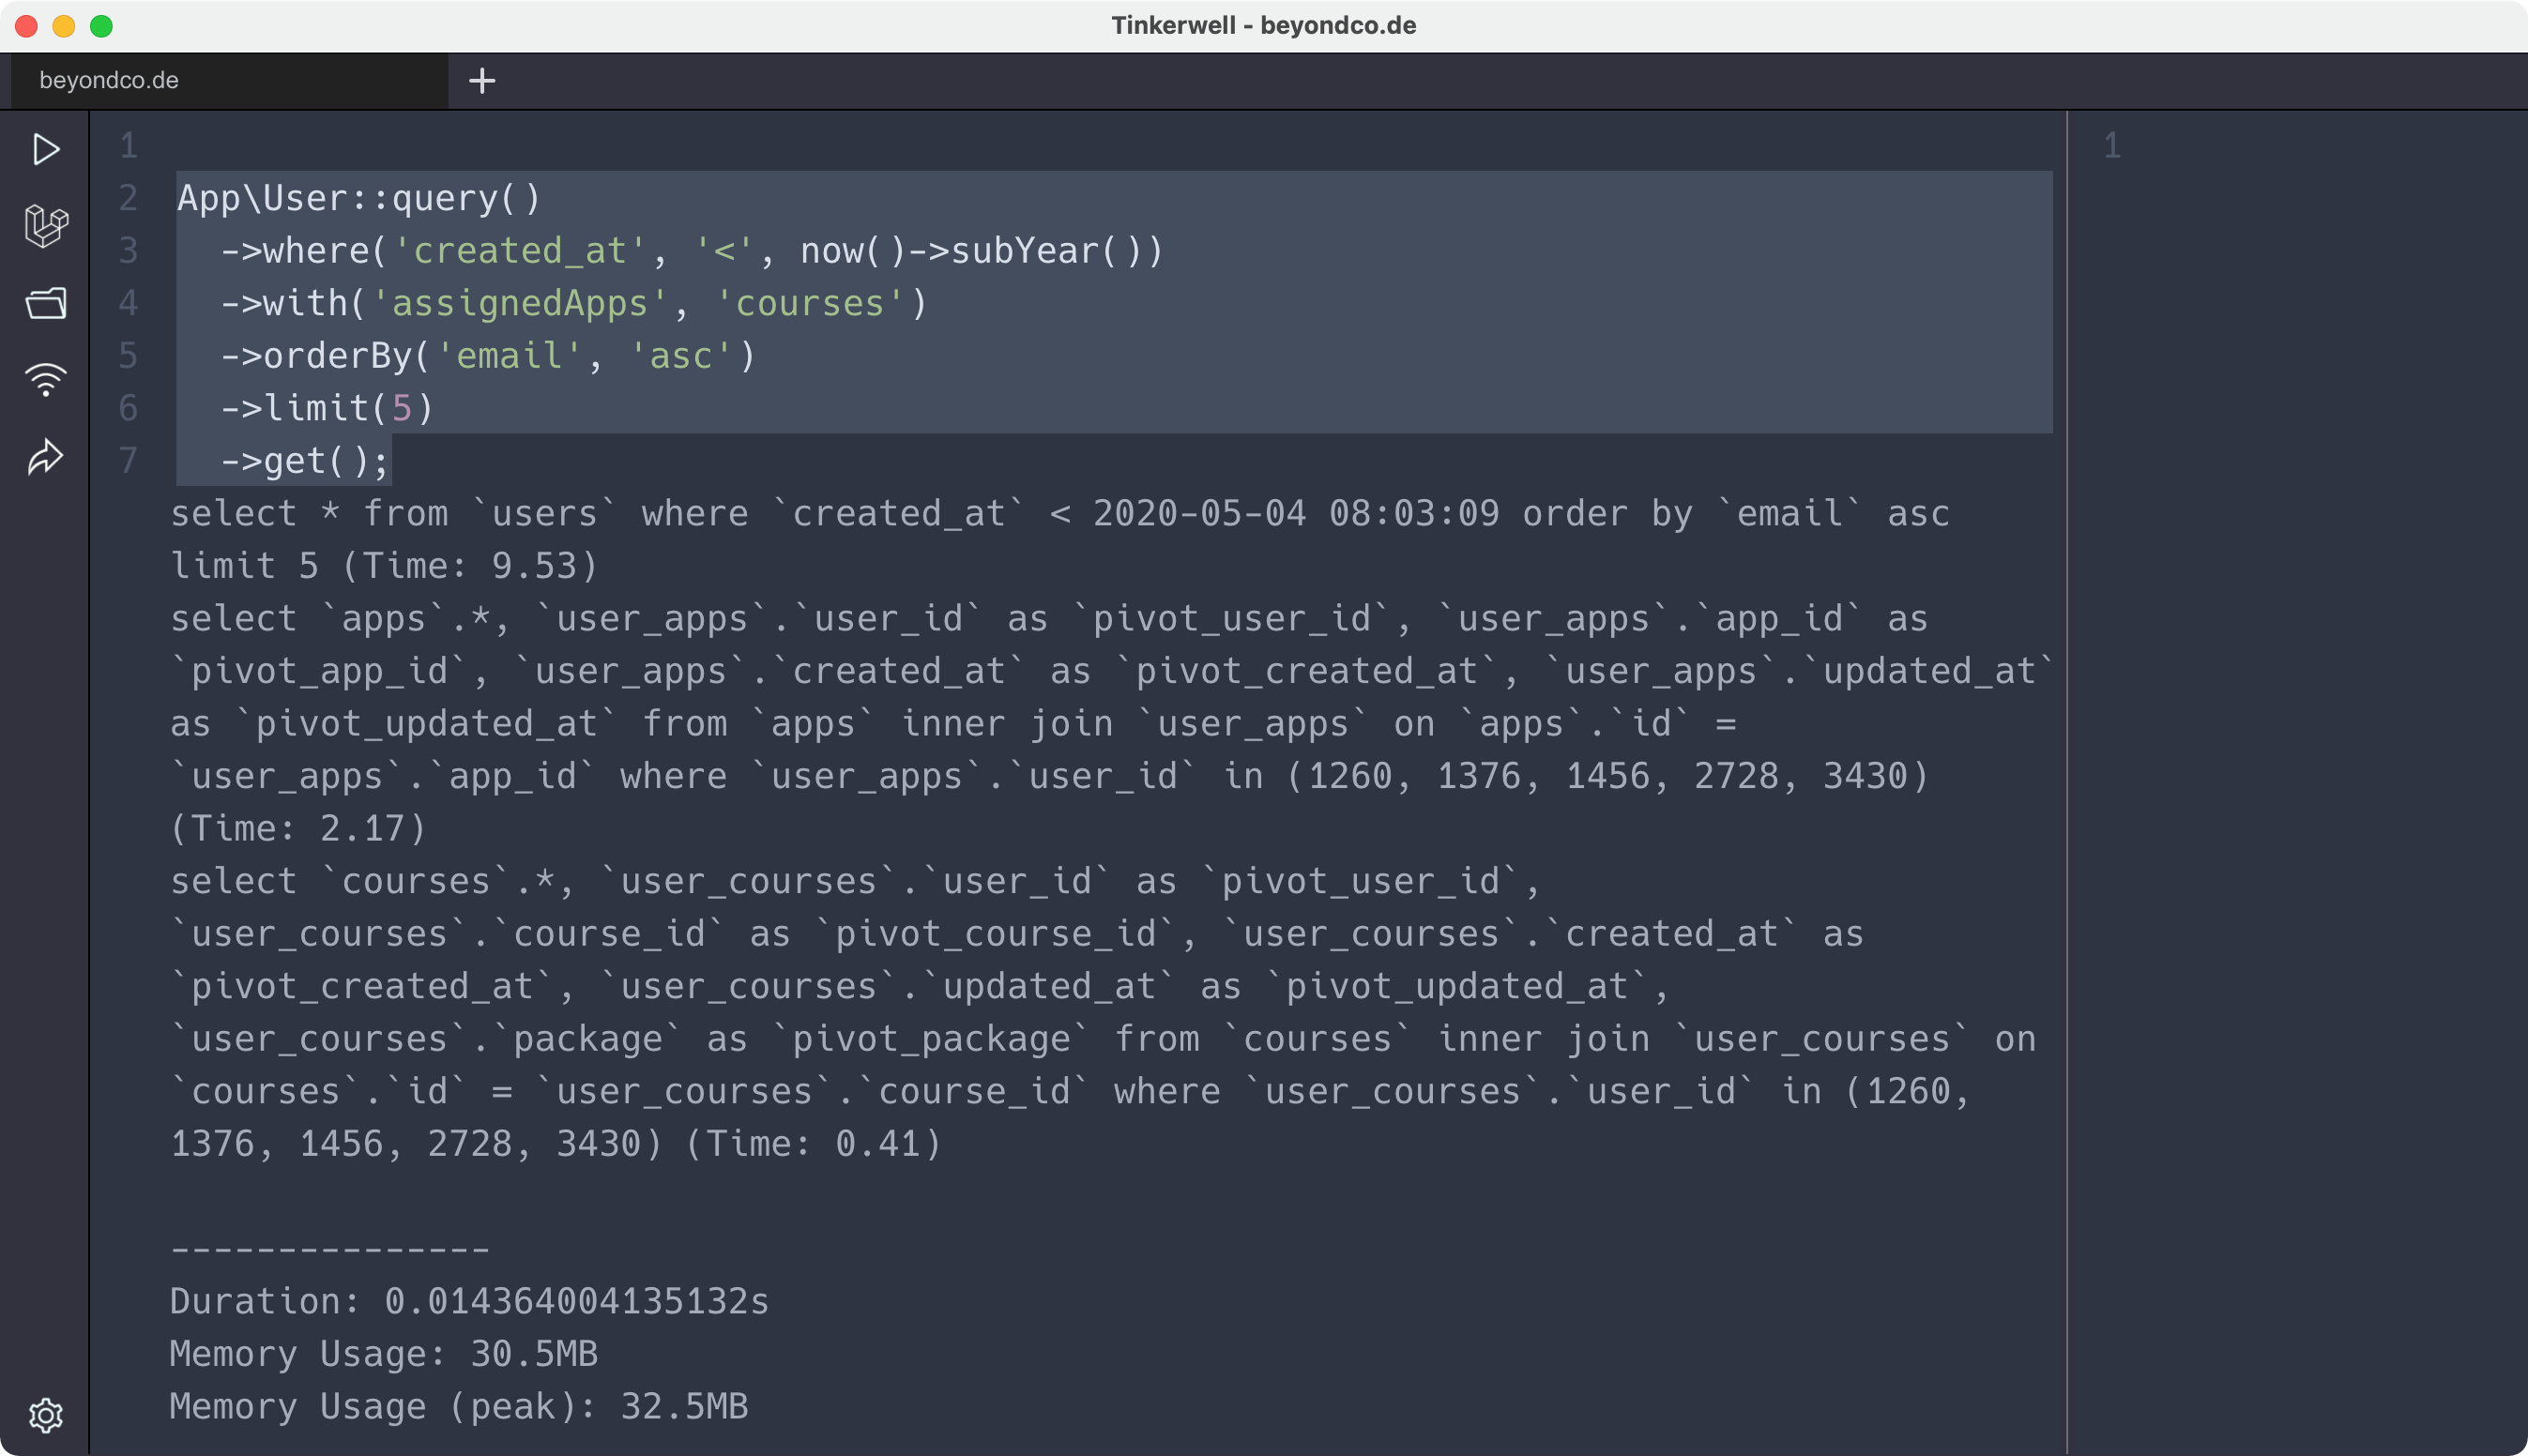
If you write your query in Tinkerwell anyway, you can highlight the Eloquent query and press Cmd+Shift+R (or Ctrl+Shift+R if you are on Windows) and Tinkerwell profiles the query directly in the editor. You see all executed queries, the time that the query run, the memory consumption and even the peak for your memory. This is super useful if you debug server crashes or want to know how much memory your application server needs.

There are multiple ways how to get the raw SQL query for an Eloquent call – we are using Tinkerwell daily and so this is our natural way to debug queries.
"Tinkerwell allows me to prototype ideas in the most efficient way possible. I feel like my life was different before it."

"The app is amazing. I always wanted a scratchpad that directly executes code in the context of my projects. Now I can even do it remotely, in production. Marcel and Beyond Code do incredible work."

The must-have companion to your favorite IDE. Quickly iterate on PHP code within the context of your web application.
Buy now Learn more