
 Tinkerwell
Exporting data from multiple Laravel Eloquent models into a CSV file
Today, a client wanted to check some data of his system and needed an Excel file to do this. Unfortunately, the data was spread across multiple tables and involved multiple calculations – something that I am not capable of doing in SQL, if this is possible at all.
The data is based on cars and their impact on the environment. In this project, we have ~42,000 different cars (brands * models * generations * engines) and they are linked with environmental impact clusters. An example of such an impact cluster can be one that combines the year of the production, the type of fuel and the size of the car. An easy to understand and calculate impact cluster is the cluster electric_car. Most electric cars are built in the last 5 years, their fuel is electricity and there is no significant lifetime difference if it is a small or luxury car. A more complex example would be a hybrid SUV that consumes electricity and diesel.
The platform for this data evolves quickly and the data becomes more accurate over time, the impact cluster is not directly linked with every car but calculated based on the latest data that is available on runtime. If there are new research results, the environmental impact of a car becomes more precise and the cluster changes. The electric_car is a good example for that – electric vehicles get a lot of traction and battery production becomes more environmentally friendly and the production of the car more automated and less resource intensive. This leads to more precise data for new cars and re-calculating the data does make sense to get a better understanding how good or bad a product is for the environment compared to their predecessors.
A simplified dataset looks like this:
Cars:
| Brand | Model | Generation | Fuel |
|---|---|---|---|
| Brand A | Model B | 1st gen (2018-now) | Petrol |
| Brand A | Model C | 3rd gen (2019-now) | Hybrid (LPG) |
There are all kinds of different factors and calculations but at the end of the day, the first car is mapped to impact cluster X and the seconds car to impact cluster Y. This application does this directly in the Laravel Eloquent model in a function. This function returns a relation to the specific cluster.
What is a cluster? A cluster has a name and values for impact categories. Example categories are CO2 emissions and water consumption. Every cluster has a unit – this can be kg for products like food, but pieces for cars. Keeping our car example, we need to know if the function that calculates the correct cluster and their emissions is correct and spot check this with data directly from scientific research.
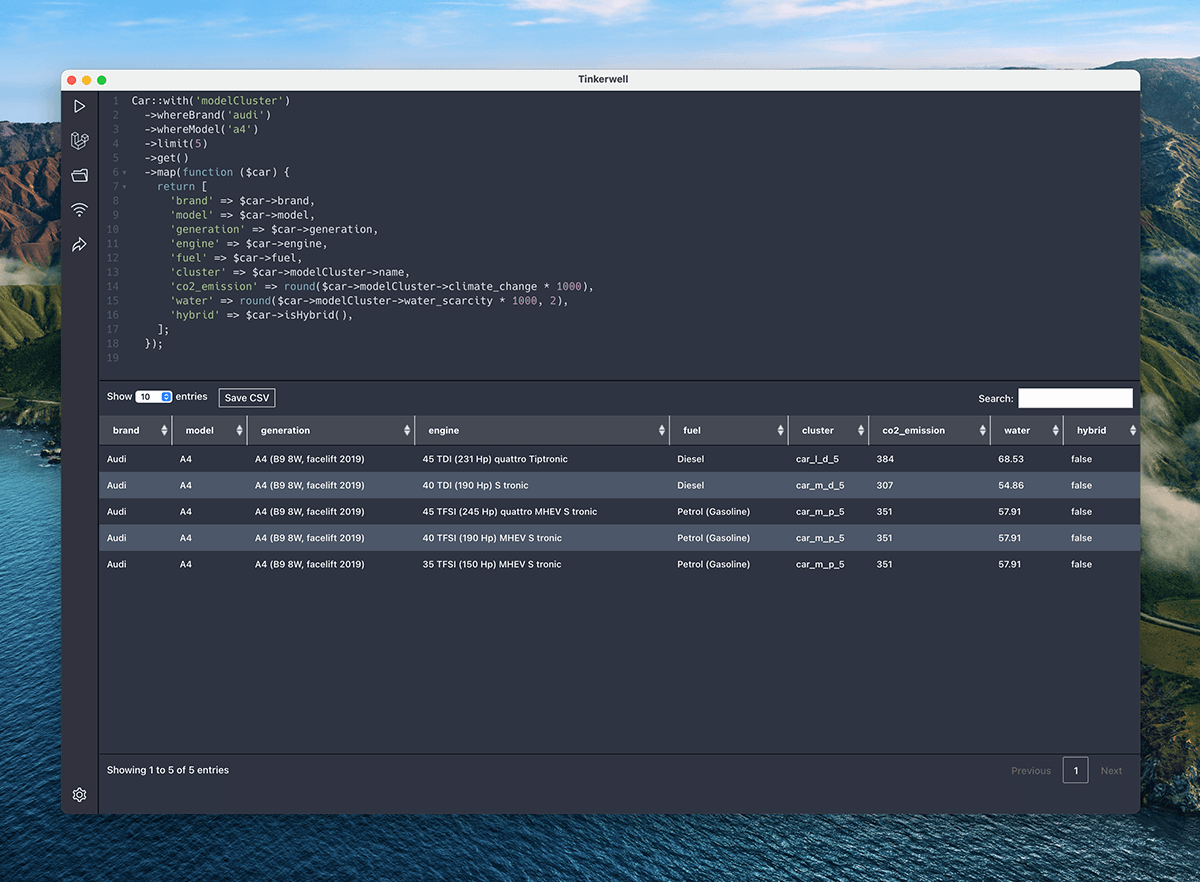
Exporting this data is possible with Laravel Excel or a similar package. You can require the package via composer and create an export for the data in a temporary route, deploy the application and download a CSV file. You can directly build this without an external tool and write a file to disc, grab it via SFTP and send it to your client. Or you can do this with Tinkerwell, run an Eloquent call for the Car model, pipe it through a collection and download the CSV file within the table view with a click. This is what I did:

It's hard to explain why you need Tinkerwell, but once you start using it, you'll use it daily.
"I use Tinkerwell all the time now. Love that app."

"The amount of time and nerves I save with Tinkerwell is insane. Especially for setting up any new packages, api-requests, validating new implementations and writing tests."

The must-have companion to your favorite IDE. Quickly iterate on PHP code within the context of your web application.
Buy now Learn more